Data
- Obtaining
- Supplying
- High-Frequency
- Bottom Pressure Records
- Other Long Records
- GLOSS/ODINAFRICA Calibration Data
Donate
Donate to PSMSL
Data Notes
- Individual Station Data and Plot Notes
- Referencing the Data Set
- PSMSL Help File
- 2010 Changes to the PSMSL Data Files
Extracted from Database
03 Mar 2025
Station Information
| Station ID: | 47 |
| Latitude: | 58.974339 |
| Longitude: | 5.730121 |
| Coastline code: | 40 |
| Station code: | 261 |
| Country: | NORWAY |
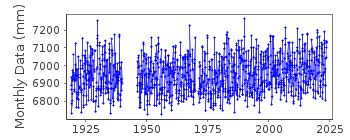
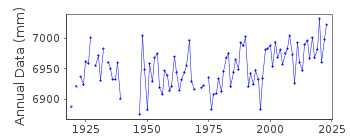
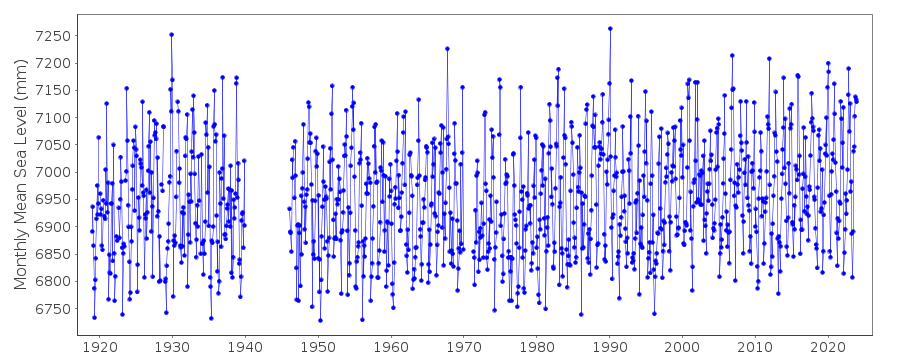
| Time span of RLR data: | 1919 – 2024 |
| RLR completeness (%): | 92 |
| Time span of metric data: | 1881 – 2024 |
| Metric completeness (%): | 70 |
| Date of last update: | 09 Jan 2025 |
| Green Arrow: | Current Station |
| Yellow Marker: | Neighbouring RLR Station |
| Red Marker: | Neighbouring Metric Station |
Please note: In many cases, the station position in our database is accurate to only one minute. Thus, the tide gauge may not appear to be on the coast.
Tide Gauge Data
Additional Data Sources (guide to additional data sources)
Nearby GNSS Stations from SONEL: STASNearby Real Time Stations from VLIZ: stav
Station Documentation
Link to RLR information.Documentation added 1991-06-11
Stavanger 040/261 RLR(1964) is 9.9m below BM B38N16Documentation added 1995-03-30
tide gauge network modernised, new equipment installed in 1987Documentation added 2009-01-28
Following the input of revised data values station made Metric awaiting datum information.Documentation added 2009-04-06
2007/8 mean sea level values entered as METRIC only awaiting confirmation of a datum query.Documentation added 2009-10-29
The Norwegian Mapping Authority have revised their datasets.Whole dataset for Stavanger now refers to TGBM B38 N37 9.697m above TGZ. A value for RLR 2008 was calculated.Documentation added 2010-04-19
Several datapoints have been removed from the record these are April 1922 and October 1933 these were data spikes. Also January - August 1970 as these appear to be approximately 1m lower than the rest of the record. None of these datapoints are available on the Norwegian website.Documentation added 2012-09-05
For information on sea level rise along the Norwegian coast see paper "Contributions to sea leve; variability along the Norwegian coast for 1960-2010"by K. Richter, J.E.O. Nilsen and H. Drange.Documentation added 2015-11-17
The PSMSL has been notified by the Norwegian Authority that the tide gauge at Stavenger is sinking. The rate of sinking has been confirmed as 0.71mm/year. With the supply of the 2014 sea level data a revised dataset beginning January 1988 has been supplied. Future data will be supplied with the correction applied.Documentation added 2018-01-30
Using updated values supplied by the Norwegian Mapping Authority data points for September-December 1987 have been revised.Data Authority
Norwegian Mapping AuthorityHydrographic Service
Po. Box 60
4001 Stavanger

![]()
![]()
![]()