Data
- Obtaining
- Supplying
- High-Frequency
- Bottom Pressure Records
- Other Long Records
- GLOSS/ODINAFRICA Calibration Data
Donate
Donate to PSMSL
Data Notes
- Individual Station Data and Plot Notes
- Referencing the Data Set
- PSMSL Help File
- 2010 Changes to the PSMSL Data Files
Extracted from Database
13 Jul 2026
WARNING: QCFLAG EXISTS. PLEASE READ THE DOCUMENTATION.
Station Information
| Station ID: | 15 |
| Latitude: | 53.4 |
| Longitude: | -3 |
| Coastline code: | 170 |
| Station code: | 211 |
| Country: | UNITED KINGDOM |
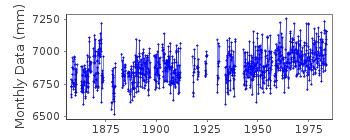
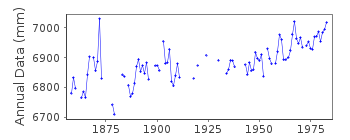
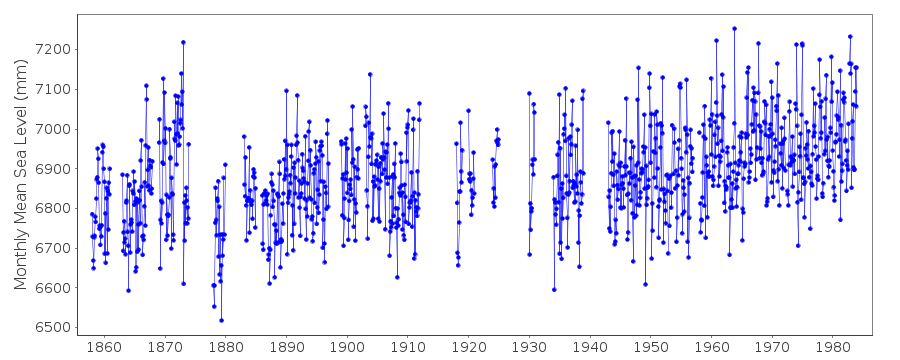
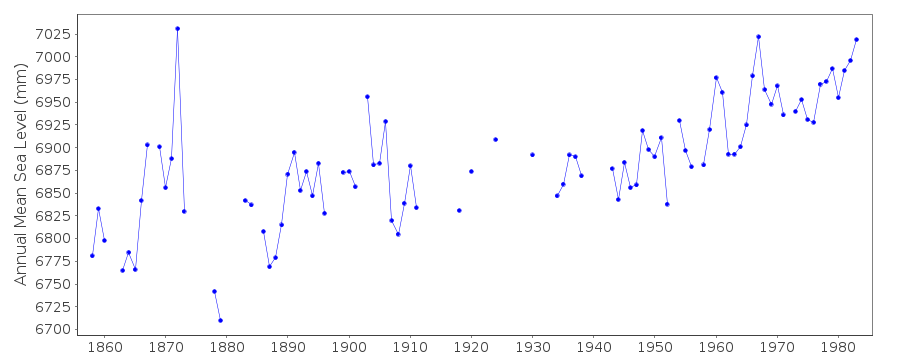
| Time span of data: | 1857 – 1983 |
| Completeness (%): | 75 |
| MTL Data: | 1903-1911 |
| MTL-MSL (mm): | 65 |
| Date of last update: | 13 Jan 2026 |
| Green Arrow: | Current Station |
| Yellow Marker: | Neighbouring RLR Station |
| Red Marker: | Neighbouring Metric Station |
Please note: In many cases, the station position in our database is accurate to only one minute. Thus, the tide gauge may not appear to be on the coast.
Tide Gauge Data
Additional Data Sources (guide to additional data sources)
Nearby GNSS Stations from SONEL: LIVENearby Real Time Stations from VLIZ: live2, live
Station Documentation
Link to RLR information.Documentation added 1994-07-20
Princes stilling well gauge was maintained by the Mersey Docks and Hbr Board with chart reductions in later years by Bidston Observatory (POL)Documentation added 1994-09-21
At Princes there was a Bailey gauge up to 17 July 1957 Kent gauge 31 December - 12 January 1984 Lege gauge 13 October 1956 - 31 December 1974 NB some overlap of records - perhaps 2 wells but this is not clearDocumentation added 1999-05-18
Following a review of all data from both Liverpool Georges Pier and Liverpool Princes Pier the two series have been combined. The data up to 1911 is from Georges Pier and for the years 1858-1901 was based on 24 readings per day; for 1903-1911 values were based on high and low water readings. For Princes Pier the 1959-62 data was based on 8 readings per day; all data up to 1958 and since 1963 was based on 24 readings per day. Data 1903-11 are Mean Tide Level (MTL) which can be converted approx to MSL by subtracting 45mm (NOTE: value superseded in 26-Jan-2016 entry). Large values at the start of the Georges record have been blamed on excessive loading of the Georges landing stage - see references belowDocumentation added 1999-05-18
See: Woodworth, P.L. 1999. A study of changes in high water levels and tides at Liverpool during the last two hundred and thirty years with some historical background. Proudman Oceanographic Laboratory Report No.56 (in preparation). Also: Woodworth, P.L. 1999. High waters at Liverpool since 1768: the UK's longest sea level record. Geophysical Research Letters, 26(11),1589-1592,1999.Documentation added 2000-04-26
Liverpool G&P Piers 170/211 RLR(1981) is 14.0m below TGBM No.G3979Documentation added 2001-01-02
Recent work on vertical land movements in the UK can be found from the University of Nottingham web site: http://ukcogr.iessg.nottingham.ac.uk/~eosi/Documentation added 2016-01-26
A value of MTL-MSL=65 mm has been applied to the RLR data for the period 1903-1911. The values were derived using the GESLA2 (high-frequency tide gauge) dataset using harmonic constituents. Note that this value does differ from the value of 45 mm which had been previously listed in the 1999 entries.Documentation added 2026-01-08
1857-1903 data has been replaced based on data recovered by the Zooniverse UK Tides project. Previous data was based on hourly observations recorded in Pub Sci No 19 (1958), this new data is based on ledgers of recorded measurements read off a mareogram at 15-minute intervals donated to NOC by Peel Ports. Several gaps appear due to some missing ledgers, and a major fire at the docks in July 1874.We have restored the original datum of the observations, heights above the Old Dock Sill in Liverpool, 3.045 metres above the previously used datum, the value of ACD used pre-1975. See Woodworth (1999) for a discussion of the transfer of the datums around the various Liverpool sites (https://nora.nerc.ac.uk/id/eprint/3916/1/ir56.pdf).
The values were recorded on a chart driven by a chain linked to the landing stage at George's Pier, effectively using the entire landing stage as a float gauge. However, debris would occasionally collect beneath the stage which would run aground at low tides, leading to the loss of the bottom of the tidal curve until the debris was cleared. This is particularly apparent in 1880-1882 and 1897-1898. These short gaps (less than four hours) have been interpolated using cubic splines before calculating monthly means, following the practice used for modern UK data. However, we have flagged these years as a precaution, as the missing values are all at low water.
Data Authority
British Oceanographic Data CentreNational Oceanography Centre
Joseph Proudman Building, 6 Brownlow Street
Liverpool
L3 5DA

![]()
![]()
![]()