Products
- Google Earth Visualisation
- PSMSL Data Coverage
- GLOSS Station Handbook
- Mean Sea Level Anomalies
- Derived Trends
- Sea Level Reconstructions
- Commentaries
- Author Archive
- GLOSS-Related Information
Donate
Donate to PSMSL
Trends
Explore the Dataset

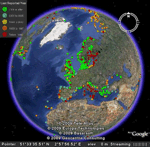
Click on globe to browse dataset in Google Earth

Click on map to browse sea level anomalies
Extracted from Database
19 Jan 2026
Series length required for levels of uncertainty
This map shows our best estimates of how long a series would be required at a site to produce an trend with an uncertainty of 1.0, 0.5 or 0.1 mm per year. These results were generated as part of our trend fitting procedure
| Under 30 Years | Under 40 Years | Under 50 Years | Under 75 Years | Under 100 Years | Under 200 Years | Over 200 Years |
| Length of series required for wanted uncertainty, years | ||||||


