CME Portal
- Portal Homepage
- Tide Gauge Data Viewer
- Auto QC Procedure
- Sea Level Data Catalogue
- Sea Level Projections
Donate
Donate to PSMSL
Caribbean Tide Gauge Data Catalogue
This page contains information about the various sources of tide gauge data from the Caribbean. By selecting a supplier from the menu below you can see what type of data they distribute, and where to find it. This will also change the displayed map to show the network of sites available from the chosen distributor.
In order to focus on gauges from the Caribbean and Central American distributors, the map below does not include available tide gauges from Brazil, Colombia, Ecuador, Mexico, the United States (apart from Puerto Rico and the US Virgin Islands), and Venezuela. Data from French overseas departments and British overseas territories are included.
Sources of Tide Gauge Data
Click on the section headers for an explanation of the type of data available from each source.
PSMSL (Permanent Service for Mean Sea Level)
Location: https://psmsl.org
Data type: Quality controlled monthly and annual data
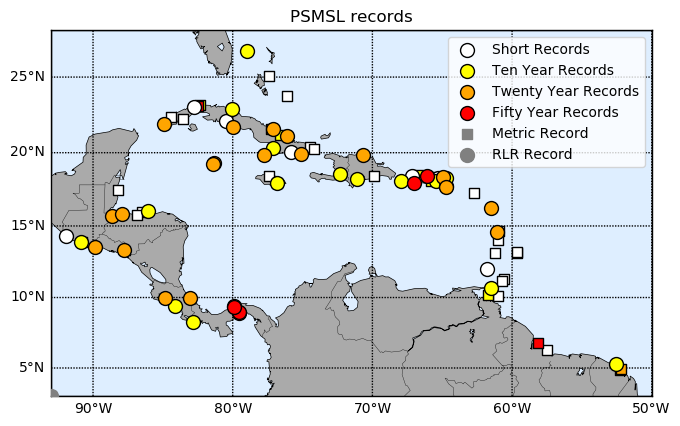
The PSMSL holds quality controlled monthly and annual mean sea level from tide gauges. PSMSL has two classes of data, RLR (Revised Local Reference) and Metric. The names for the classes may be somewhat obscure, but as explained on the website, the vertical reference frame of records is monitored by recording the height of the data relative to a local physical benchmark, and monitoring the stability of the benchmark through frequent geodetic levelling campaigns. The benchmark should be sited on stable ground, so any vertical movement is representative of larger-scale movement of the area. Where all this has been done, the record can be included in the RLR dataset.
Stations in the Metric dataset do not have this guarantee of long term vertical stability, so may contain sudden jumps or long term drifts that are not the result of changes in sea level, or vertical movement in the height of the tide gauge benchmark. As a result, they cannot be used to estimate long term changes in sea level, but could be used in limited cases, e.g. studying seasonal cycles.
Data is available in a simple ASCII format, and data can be obtained from individual sites (RLR sites, Metric sites). Alternatively, the entire dataset can be downloaded in a zip file. The dataset can be explored through an interactive map. Each stations has a dedicated metadata page giving more information about that site (e.g. Newlyn).
UHSLC (University of Hawaii Sea Level Center)
Location: https://uhslc.soest.hawaii.edu/
Data type: Quality controlled hourly and daily data
The University of Hawaii Sea Level Center makes daily and hourly sea level data available. They publish two separate data streams:
- ‘Fast-delivery’ data: data released within 1-2 months of collection, receiving only basic quality control, which only removes spikes, large level shifts and obvious outliers.
- ‘Research-quality’ data, archived in the Joint Archive for Sea Level (JASL). This is fully quality controlled, with vertical reference frames monitored throughout the length of the series.
Data can be obtained in ASCII and netCDF format (for fast-delivery or research quality), or via THREDDS or OPenDAP data servers.
Global Extreme Sea Level Analysis (GESLA)
Location: https://gesla.org/
Data type: Hourly and higher frequency data, assumed to be quality controlled
The GESLA dataset of high-frequency (hourly or more frequent) data was collated in 2009 and updated in 2017. It is the combination of hourly records from the JASL data set distributed by UHSLC and other data obtained from operators of tide gauge networks. The curators of the GESLA dataset have not done any quality control of their own on the data, but data should have been quality controlled by the supplying authority.
Data is distributed in an ASCII format, and can be obtained from the GESLA website.
IOC Sea Level Monitoring Facility
Location: http://www.ioc-sealevelmonitoring.org/
Data type: Real time high frequency data, with no quality control
The IOC Sea Level Monitoring Facility (operated by the Flanders Marine Institute, VLIZ) is a web portal that receives and distributes data from tide gauges in real time. Originally developed for tsunami monitoring, the facility now hosts data from sites across the world. Data arrives in real time, and has absolutely no quality control.
Data is available in a variety of text formats, including JSON and XML formats. Data can be obtained using a REST web service: details of how to use it are given here. A maximum of 30 days can be obtained in a single call. For example, the real time data recorded at Stornoway in January 2012, can be obtained in text format from the URL http://www.ioc-sealevelmonitoring.org/service.php?query=data&code=stor×tart=2012-01-01&timeend=2012-01-31&format=ascii.
National Oceanic and Atmospheric Administration (NOAA), USA
Location: https://tidesandcurrents.noaa.gov/
Data type: Quality controlled data, frequencies range from 1 minute to monthly
Data from the US tide gauge network in the Caribbean can be downloaded from their website. Data for each individual site (e.g. Mona Island, Puerto Rico) can be downloaded in text format as 6 minute, hourly, daily or monthly data (select Tides / Water Levels; Water Levels). Data is initially available as ‘preliminary data’, and is replaced by verified data after quality control has been completed. Fitted harmonic constituents are also available at each site (e.g. for Lime Tree Bay, St. Croix), along with information about tidal datums and benchmarks.
All data can also be downloaded via the CO-OPS API: this option also allows for the download of data at a frequency of one minute.
Service Hydrographique et Océanographique de la Marine (SHOM), France
Location: https://data.shom.fr
Data type: Quality controlled data, frequencies range from 1 minute to hourly
Data from all French overseas departments can be downloaded from the SHOM (Service Hydrographique et Océanographique de la Marine) data portal. This portal contains all data produced by SHOM. To find the tide gauge data, following these instructions (which assume you are using the English version of the portal):
- Click the “Access to Shom catalog” button
- Click the “Coastal Observations” tab
- Click “REFMAR”
- Select both the “RONIM” and “Partners” tide-gauge check boxes.
- Pan the map to the Caribbean.
- Select a site to view / download, and follow instructions.
Data is available in the original sampling frequency (typically 1 minute), or hourly.
Further instructions are available (in French) from a PDF file on the SHOM website, see Chapter 8 for information specific to tide gauges. This also describes methods of downloading data via SHOM’s web services.
Système d’Observation du Niveau des Eaux Littorales (SONEL)
Location: http://www.sonel.org/
Data type: Daily GNSS data - information about land movement at or near tide gauges
SONEL are a data bank distributing information about the rate of land movement at or near tide gauges as measured by GNSS (GPS and other similar systems) receivers. Daily data can be downloaded in text format via the interactive map or via the SONEL FTP server. SONEL also provide estimates of the vertical land movement at each site.
Tide gauge data at each site is measured relative to a local vertical reference frame, whereas GNSS receivers measured heights above a reference ellipsoid. Where a GNSS receiver is located at or near a tide gauge, and the two reference frames are connected by levelling, the tide gauge data can be expressed relative to the ellipsoid, which can allow comparison between tide gauge data and satellite altimetry. Further explanation is available on the PSMSL website. A list of stations where this link has been made is also available.
SONEL also distribute tide gauge data from the French network at daily, monthly and annual timescales.
Summary File
This information is summarised in an Excel file, note the following:
- Stations within the window 0 – 30° North, 100 – 50 ° West are included.
- Stations from larger nations have been omitted, as they are mostly on the edges of the window. Nations omitted: Brazil, Colombia, Ecuador, Mexico, United States (expect for Puerto Rico and US Virgin Islands), and Venezuela. French overseas departments are also included.
- Sites close to each other have been combined into one row – with ‘close’ meaning within approximately 10 km. As a result, the name used may not match the name used on the data supplier’s website.
- The ‘Local’ column refers to data available from the NOAA or SHOM websites described above.
- The ‘Operator’ column contains the names of the agency or agencies currently responsible for the tide gauge. For historic records, this will be the name of the organisation that supplied the data to PSMSL or JASL.

![]()
![]()
![]()